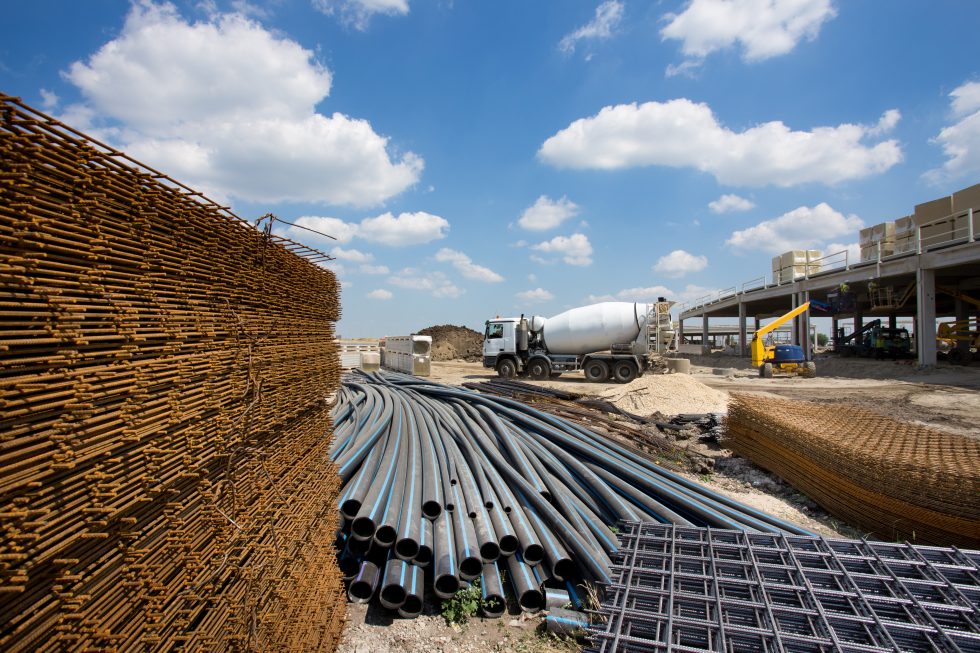
States in the Midwest led the way as transportation departments moved forward on more than 16,000 highway and bridge improvement projects in fiscal year 2021, according to ARTBA’s latest analysis of Federal Highway Administration (FHWA) data.
The association’s ‘Federal Highway Investment Benefits by State” dashboard shows that states leveraged $31.4 billion in federal funds with their own funds to advance nearly $57 billion in projects. The top five states with the most projects are:
- Missouri, 1,040
- Michigan, 903
- Ohio, 796
- Indiana, 731
- Tennessee, 663
Nearly half of the projects—43 percent—were for repair or reconstruction work. Another 20 percent added capacity, such as a new lane or widening, to an existing roadway. Six percent of funds were invested in new roads or bridges.
‘One of the most attractive benefits of major public investments in transportation infrastructure is they foster immediate economic growth and create tangible capital assets that are long-lived,’ said ARTBA Chief Economist Dr. Alison Premo Black, who compiled the data. ‘We expect to see even more projects in the coming year as states work to obligate the record increase in FY 2022 federal funding available through the Infrastructure Investment and Jobs Act (IIJA) that was approved by Congress earlier this month.”
The dashboard map allows visitors to see how each state deployed federal funds and the top projects that received federal support. The five largest projects nationally that include a mix of federal, state, local, and private funds, are:
- Georgia – SR 400 North Springs Marta Station to McFarland Road Express Lane ($3.8 billion)
- Arizona – I-17 Split ($899 million)
- Texas – Construct new roadway lanes/reconstruct existing roadway on IH 35E ($715 million)
- Nebraska – 20th St., Missouri River Omaha ($607 million)
- Louisiana – LA 1: Leeville to Golden Meadow, Phase 2 ($524 million)
The dashboard aims to provide U.S. taxpayers, elected officials, news media and the public with greater transparency about how federal highway program funds are invested annually. It allows users to see how each state annually deployed federal funds and features the top projects dating back to 1950. Black populates the dashboard using the data states submit to FHWA’s Fiscal Management Information System (FMIS).

Related News
ARTBA Reiterates Buy America Concerns in White House Meeting
What happened: In a Jan. 25 meeting with the White House Office of…

Billions More in Mega and INFRA Grants for Transportation Infrastructure
What happened: Thirty-seven transportation projects in 38 states will receive nearly $5 billion in…
ARTBA Meets with White House on DBE Rule Revisions
What happened: As the U.S. Department of Transportation (U.S. DOT) finalizes pending revisions to…